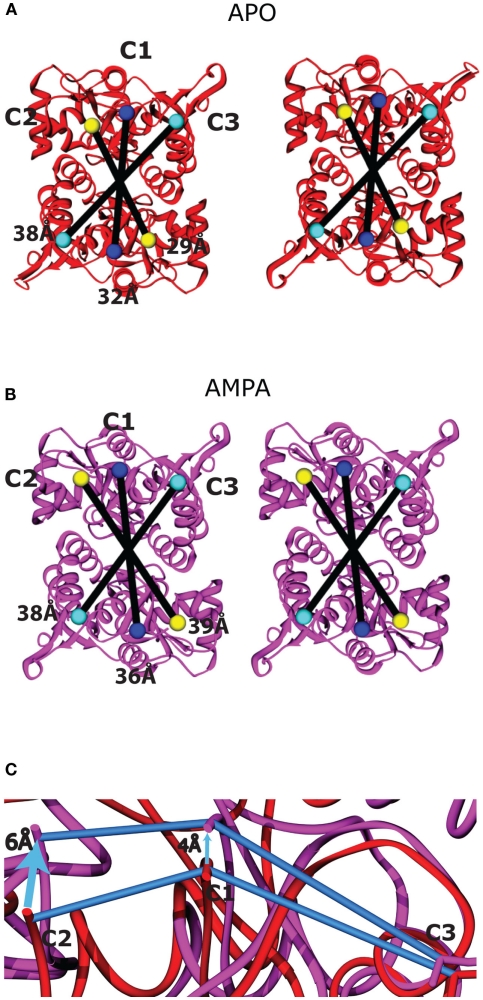
Figure A4.
Ligand-binding domain movements between the apo and AMPA-bound structures. The membrane-proximal face of the two LBD dimers is shown as viewed from the cytoplasm following superposition of the apo [(A), red] and AMPA-bound [(B), purple] states, modeled using PDB entries 1FTO and 1FTM, respectively (Armstrong and Gouaux, 2000). The residues on the LBD that connect to the TMD are colored according to the TM helix (TM1–TM3) to which they connect: C1 = Lys 506, blue; C2 = Pro 632, yellow; and C3 = Cys 773, cyan. The connecting residues are twofold symmetrical across the dimer interface and are linearly arranged. The intermonomer distances as measured from the Cα positions of the connecting residues are shown as black lines within each dimer. The C3 intermonomer distance similar in the apo and AMPA-bound structures. (C) To highlight the scissoring motion within each monomer, Lobe I of the apo (red) and AMPA-bound (purple) domains was superimposed, and the displacement of the three attachment points (connected by blue lines in each structure) are highlighted by arrows. The displacement is greatest at C2, intermediate at C1, and minimal at C3, which is closest to the hinge axis.

