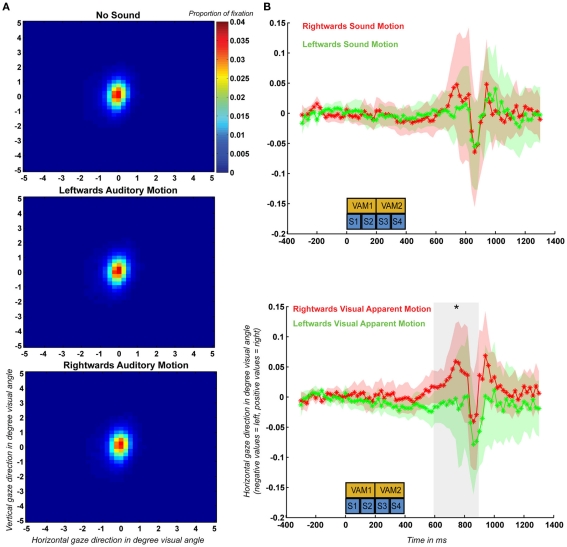
Figure 4.
(A) Spatial distribution of fixation recorded during the control experiment based on the eye-tracking data of all 10 participants plotted separately for the no-sound, leftward auditory motion, and rightward auditory motion conditions. (B) Mean and SEM (across participants) of the event-related horizontal eye movements (ERHEMs) computed for trials during which participants were presented with left and rightward auditory motion stimuli (upper graph) and mean and SEM of the ERHEMs computed for trials during which participants perceived left and rightward visual apparent motion (lower graph). The blue boxes (S1–S4) indicate the time at which the four sounds were presented during a trial and the yellow boxes (VAM1–VAM2) indicate the timing of the first and second visual apparent motion stimuli. The gray transparent box in the upper part indicates the time period (600–900 ms) during which there was a significant effect of visual apparent motion percept.

