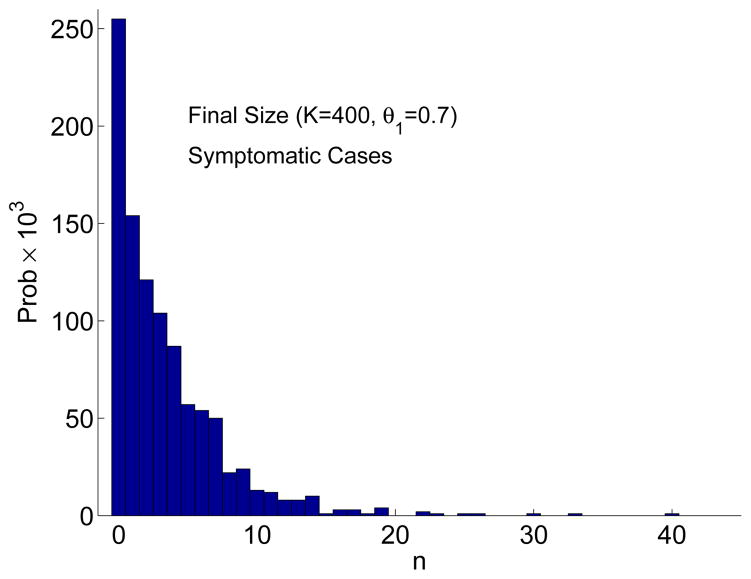
Figure 6.
Approximate final size distribution for the CTMC model based on 1000 sample paths when K = 400 and Is(0) = 1. Chemoprophylaxis begins at day 0 (θ1 = 0.7, θ2 = 0 =θ3). The bar width in the frequency histogram equals 1. Hence, for 1000 sample paths, the probability of the final size is multiplied by 103.

