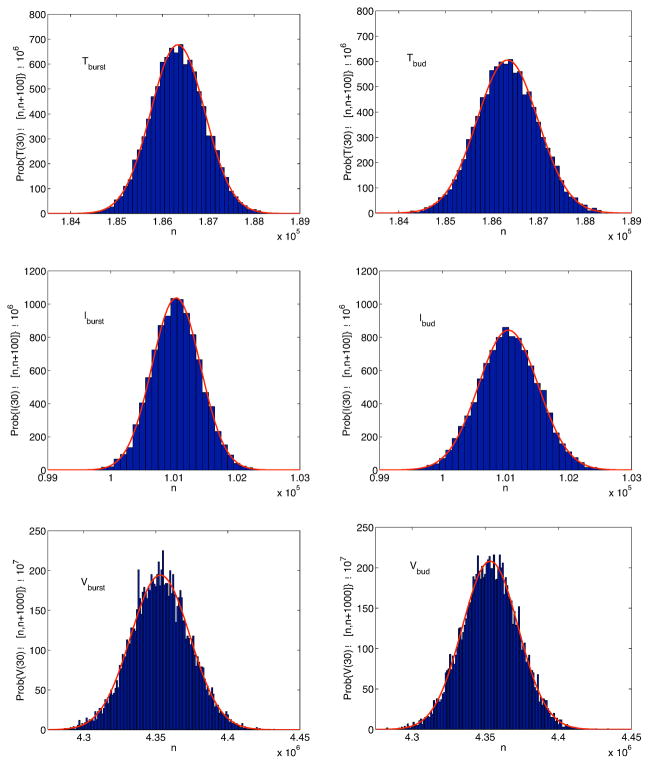
Figure 5.
Approximate stationary distribution for T, I and V for systems (14) and (16) at t = 30 days with no immune response, γ(i) = 0, i = T, I, V and
 = 2.28. Each distribution is fit to a normal curve (solid curve). The standard deviations σburst and σbud for each of the distributions are σburst(T) = 600, σburst(I) = 380, σburst(V) = 2.06 × 10⁴, and σbud(T) ≈ 660, σbud(I) ≈ 470, σbud(V) ≈ 1.90 × 10⁴.

