
Figure 4.
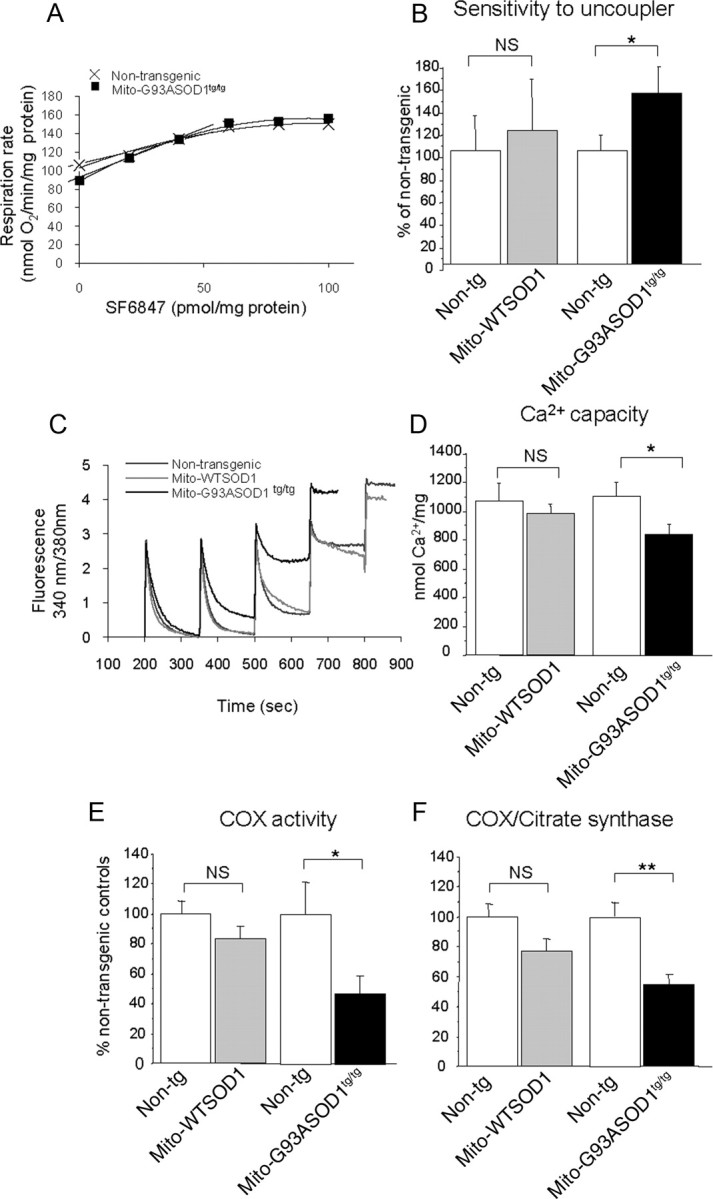
Biochemical assessments on brain purified mitochondria from control and homozygous mito-G93ASOD1 mice. A, Representative graph showing the sensitivity of brain mitochondria respiration to successive additions of 2 nm SF6847, in one non-transgenic and one mito-G93ASOD1 mouse. B, Graph representing the amount of SF6847 required to totally uncouple mitochondria respiration, determined by the respiration rate, in nanomoles of O2 per minute per picomole of SF6847. Means ± SEM are shown for 4 individual brain mitochondria preparations per group. Samples were run in duplicates. NS, not significant; *p = 0.0387 after one-tailed, unpaired, Student's t test versus non-transgenic mitochondria. Mito-G93ASOD1 brain mitochondria are more sensitive to the uncoupling effect of SF6847 than are non-transgenic ones. C, Kinetic traces of mitochondrial Ca2+ uptake in brain mitochondria from 12-month-old mice monitored by Fura 6 fluorescence ratio (340/380 nm excitation, 510 nm emission). The peaks correspond to sequential bolus additions of 25 nmol of CaCl2 (Ca2+). The downward deflections reflect mitochondria Ca2+ uptake. Non-transgenic and mito-WTSOD1 mitochondria took up 4 additions of Ca2+, whereas mito-G93ASOD1 showed loss of Ca2+ uptake after 3 additions. D, Brain mitochondrial Ca2+ capacity expressed in nanomoles of Ca2+ per milligram of protein. Mean ± SEM is shown for 3–7 independent brain mitochondrial preparations. Samples were run in duplicates. *p = 0.019 versus non-transgenic mitochondria. Mito-G93ASOD1 brain mitochondria take up less Ca2+ than mito-WTSOD1 and non-transgenic mitochondria. E, F, COX and CS enzymatic activities measured in spinal cord lysates from 12-month-old non-transgenic and mito-G93ASOD1 mice. Means ± SEM are shown for n = 7–8 mice per group. Samples were run in duplicates or triplicates. *p = 0.05 and 0.007 for COX and COX/CS, respectively, versus non-transgenic mice. Mito-G93ASOD1tg/tg mitochondria have significantly lower COX activity than non-transgenic ones. Mito-WTSOD1 and mito-G93ASOD1 mitochondria were compared with their respective matched non-transgenic controls.