
Fig. 1.
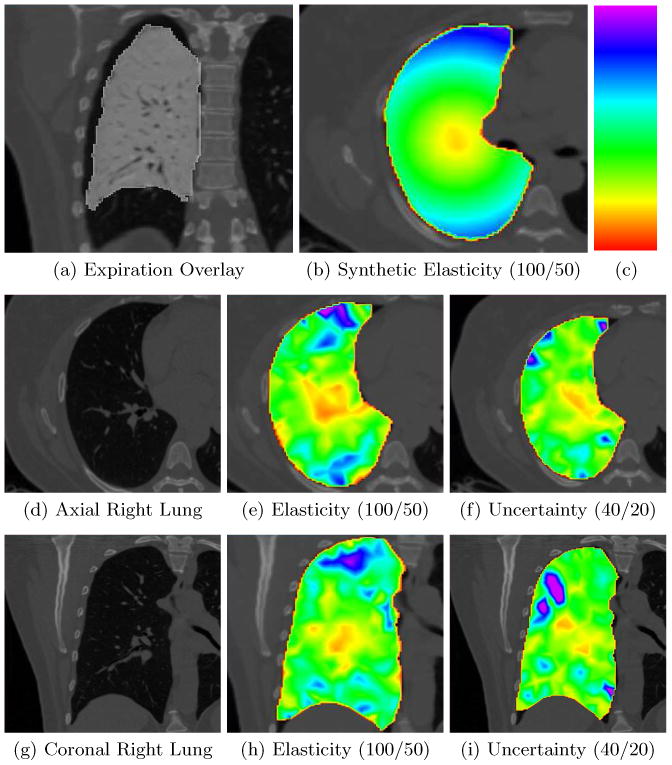
Synthetic data. All values in parentheses describe the window level setting we use to highlight tissue stiffness where the lower value of the window is colored red (softest) and the upper value is colored purple (stiffest) according to the rainbow color scheme included in (c). (a) Synthetic expiration lung with an inverted gray colormap overlaid on the inspiration volume. Notice the large deformations due to expiration. (b) The synthetic elasticity map corresponding to the slice in (d). (d) Axial slice of the inspiration lung volume. (e) Estimated elasticity. (f) The IQR uncertainty map. (g) Coronal slice of the inspiration lung volume. (h) Estimated elasticity. (i) The IQR uncertainty map. Notice that these results are consistent with the results in Fig. 2 where the general stiffness can be estimated, but with large outliers.