
Fig. 3.
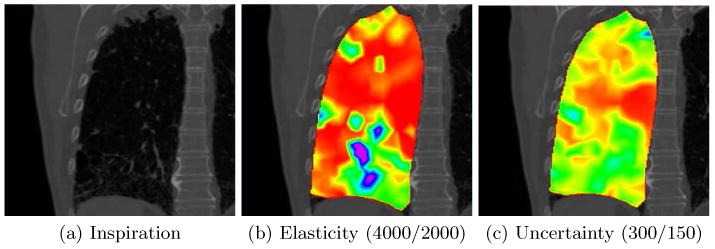
Fibrotic tissue. The elasticity and uncertainty maps are color coded using the rainbow colormap in Fig. 1 (red is soft, purple is stiff) (c) and the window level in parentheses. (a) A coronal slice of the inspiration dataset where the upper and lower part is identified as fibrotic by a physician. (b) Notice how the fibrotic areas in the lower and upper lung appear stiffer than the surrounding tissue, and also that the cyst in the lower left of the image is estimated as “soft” which could mean that it is ventilated and therefore collapses during expiration. (c) The IQR of the estimated elasticity map. The uncertainty is somewhat larger in the stiffer fibrotic area.