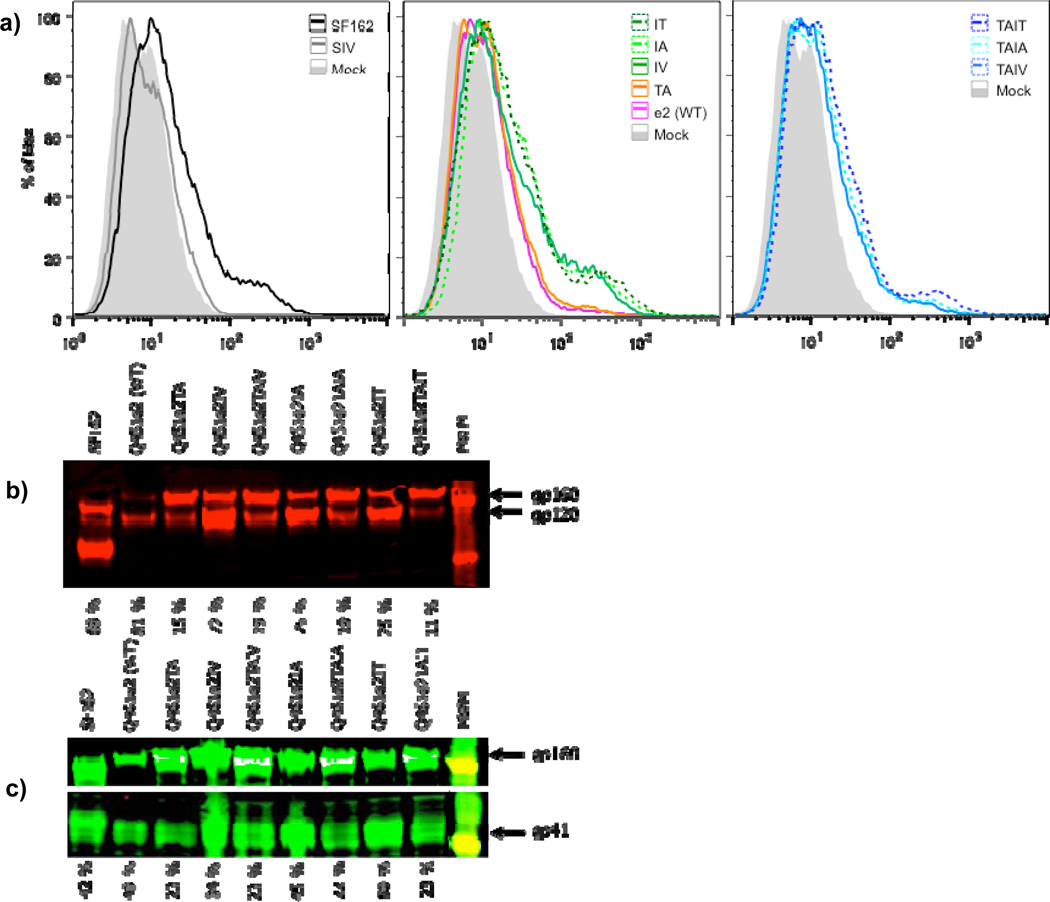
Figure 4.
(A) Flow cytometry analysis of 2F5 binding to cells expressing Q461e2 Env variants. The gray shaded profile denotes fluorescence for cells transfected in the absence of plasmid (Mock transfected cells). The color designation for the fluorescence profile for the various Envs is shown within each panel. (B) Western blot of cells expressing the Q461e2-associated Envs probed with an anti-Env polyclonal rabbit primary Ab. The Env tested in shown above the blot with the parental wild type (WT) Q461e2 indicated; the percent Env cleavage is shown below. The bands corresponding to gp160 and gp120 are designated. Percent cleavage was calculated as the ratio of gp120/(gp120 + gp160). MWM indicates molecular weight marker lane, with markers shown 181kDa and 115 kDa. (C) Western blot analysis of the same cell lysates as in panel B using a MAb cocktail. The MAb cocktail included 1 µg/ml of 2G12, b12, 2F5, and 4E10, which recognizes uncleaved Env (i.e., gp160) and cleaved Env (i.e., gp41(Moore et al., 2006)), Designations are as in panel B. MWM indicates molecular weight marker lane, with markers shown 181kDa in the upper panel and 48.8 and 37.1 KDa in the lower panel.

