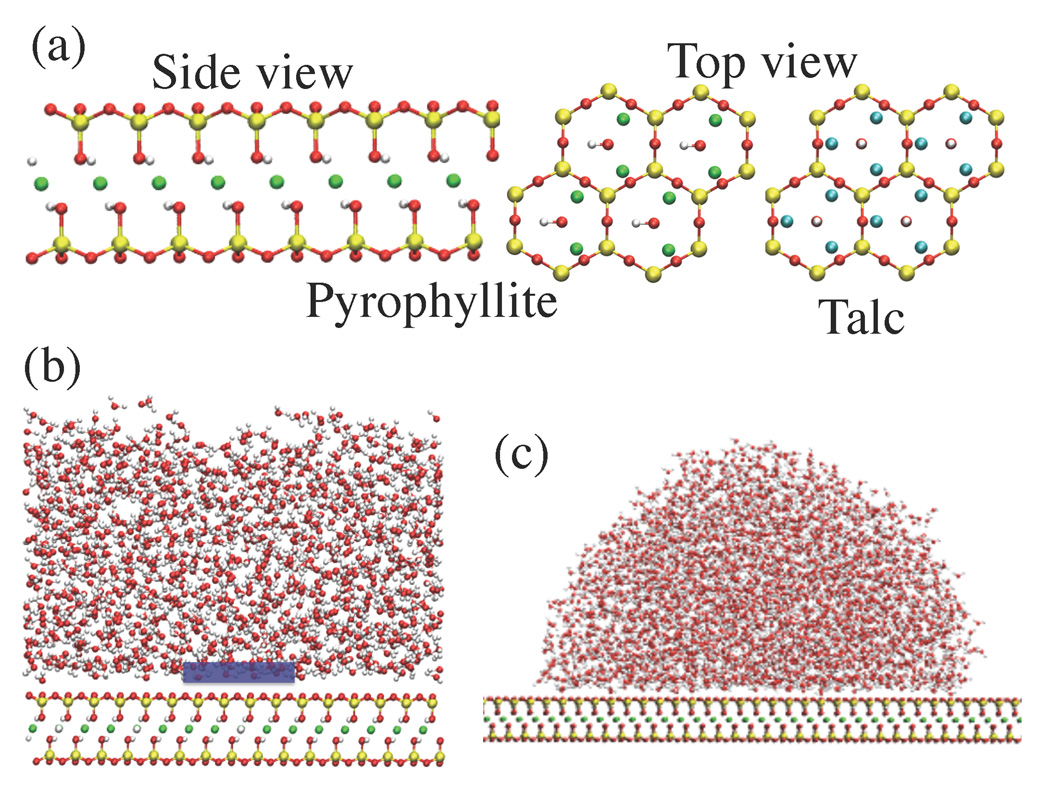
Figure 1.
(a) Microscopic clay structure (Red: O, White: H, Yellow: Si, Green: Al, Cyan: Mg atoms). The side and top views of the pyrophyllite clay sheet show the hydroxyl (−OH) groups that are parallel to the sheet. In talc (top view shown), the −OH groups are perpendicular to the sheet and can participate in hydrogen bonds with water. In fluorotalc (not shown), the talc −OH groups are replaced by F atoms. (b) Part of the simulation setup for studying the clay - water interface. The blue box is the observation volume, v, used to probe density fluctuations. (c) Simulation setup for determining contact angles.

