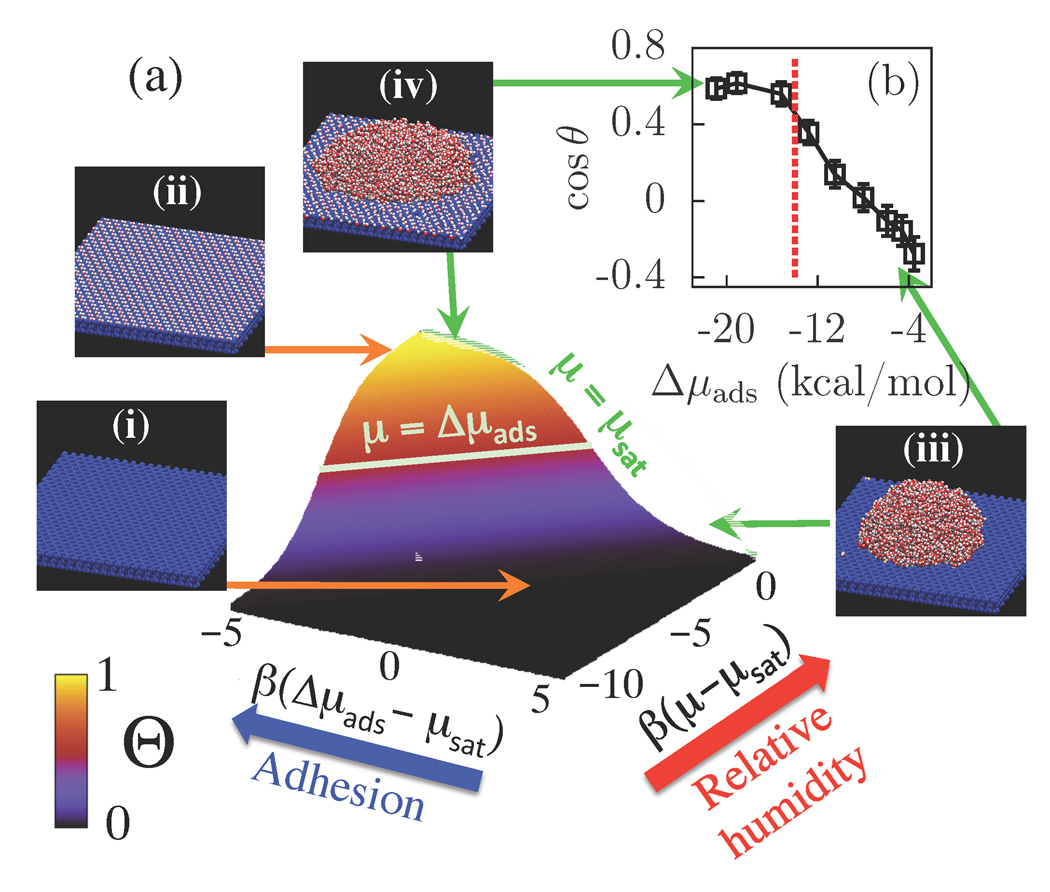
Figure 5.
(a) Schematic showing the surface coverage, Θ, over a wide range of relative humidities (RH≡P/Psat ~ exp[β(μ – μsat)]) and adhesive interaction strengths (Δμads). (b) Effect of Δμads on surface hydrophobicity quantified by cos θ. The dashed vertical line corresponds to μsat. Snapshots indicating typical configurations of water molecules (red and white) on modified talc surfaces (blue) are also shown. As the adhesive interactions (Δμads) overcome the cohesive interactions (μ), there is a transition from a dry surface [snapshots (i) and (iii)] to one covered with a monolayer of water [snapshots (ii) and (iv)].

