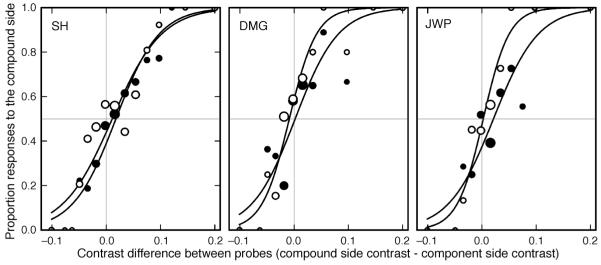
Figure 2.
Psychometric functions for Experiment 1 for trials where the compound stimulus was presented on the right (open symbols) and on the left (filled symbols). Symbol size indicates the relative number of responses underlying each data point (actual numbers vary from 1 to 92, 1 to 49, and 1 to 55 responses per point for observers SH, DMG and JWP respectively). The horizontal gray line represents the point of 50% probability of responding on the compound side. Zero on the x-axis gives the point of veridical equality (indicated by the vertical gray line). Only very small shifts from zero are seen for any observer.

