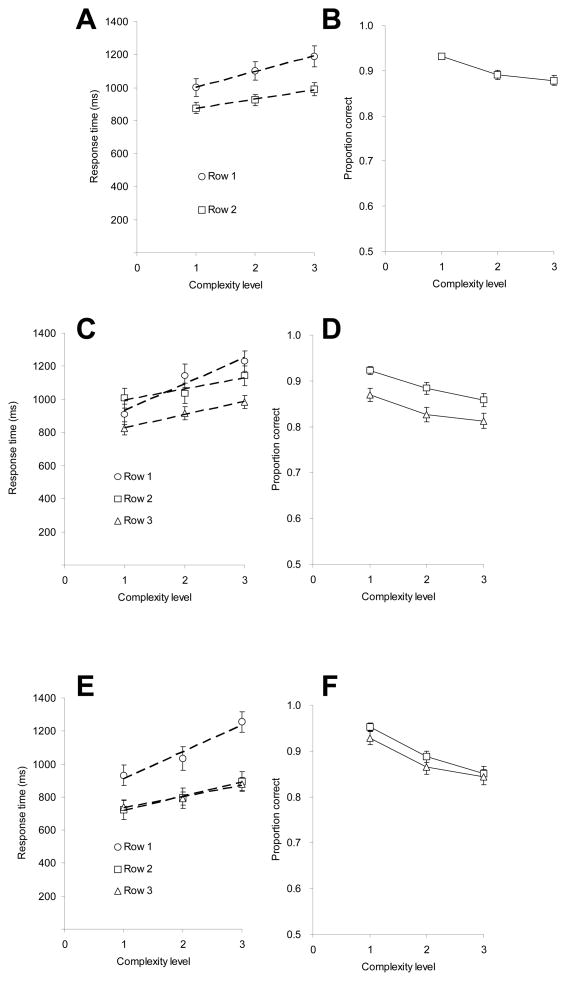
Figure 4.
Panel A represents response time (RT) as a function of stimulus complexity and stimulus row for Experiment 1 (row 1 = transfer; row 2 = retrieval of row 1), along with the best fitting regression lines; Panel B represents accuracy for row 2 as a function of stimulus complexity (Experiment 1). Row 1 is slower and more sensitive to complexity than row 2. Panel C: RT as a function of stimulus complexity and stimulus row for Experiment 2 (row 1 = transfer; row 2 = transfer and retrieval of row 1; row 3 = retrieval of row 2), along with the best fitting regression lines; Panel D shows accuracy for rows 2 and 3 as a function of stimulus complexity (Experiment 2). Row 1 is slower and more sensitive to complexity than rows 2 and 3, which have identical RT-by-complexity slopes. Panel E: RT as a function of stimulus complexity and stimulus row in Experiment 3 (row 1 = transfer; row 2 = retrieval of row 1; row 3 = retrieval of row 1), along with the best fitting regression lines; Panel F: accuracy for rows 2 and 3 as a function of stimulus complexity (Experiment 3). Row 1 is slower and more sensitive to complexity than row 2 and 3, which do not reliably differ in RT. Error bars represent standard errors. Complexity level 1 includes conditions with C = 1 and C = 8, level 2 with C = 2 and C = 7, level 3 with C = 4 and C = 5. Error bars represent SE.

