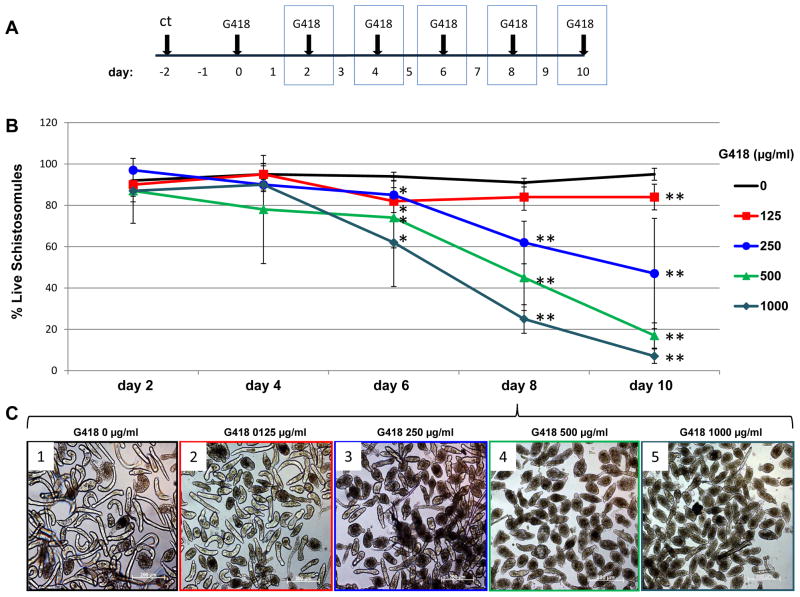
Fig. 2.
Dose response curve for schistosomules of Schistosoma mansoni to the aminoglycoside antibiotic, G418/geneticin. (A) Schematic showing the experimental design. Micrographs were captured on days highlighted with the blue boxes. ct: cercarial transformation to produce schistosomules. (B) Survival curve showing percentage of live schistosomules plotted against time in culture. Concentrations of G418 are indicated. Bars on curves represent 1 S.D. of the mean. ANOVA and Student’s t-test were performed among groups cultured in the presence of the indicated concentration of G418 and controls without the antibiotic. * P ≤ 0.05, ** P ≤ 0.01. (C). Representative images of schistosomules cultured in the presence of G418 for 8 days; 1: 0 μg/ml, 2: 125 μg/ml, 3: 250 μg/ml, 4: 500 μg/ml, 5: 1000 μg/ml G410. Scale bars, 200 μm.

