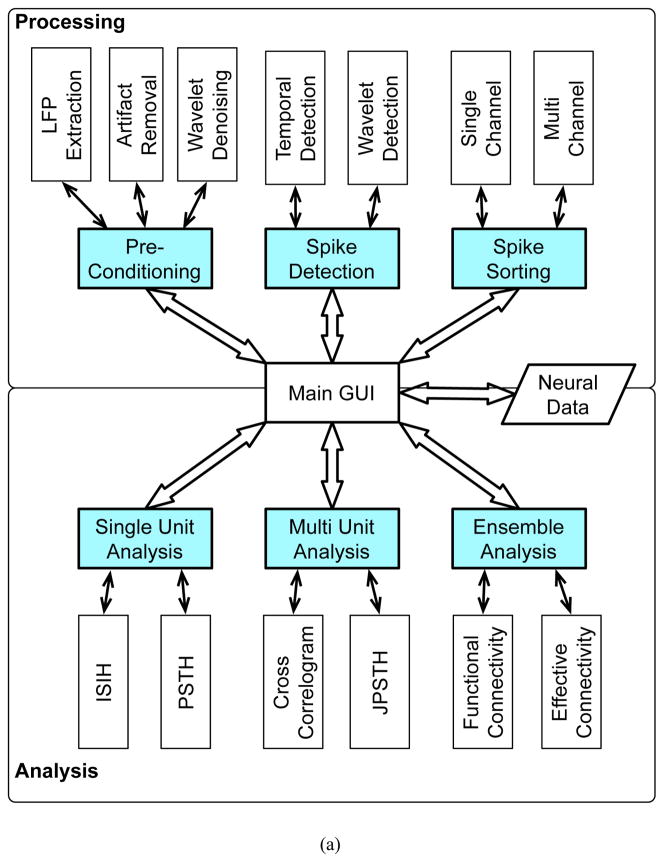
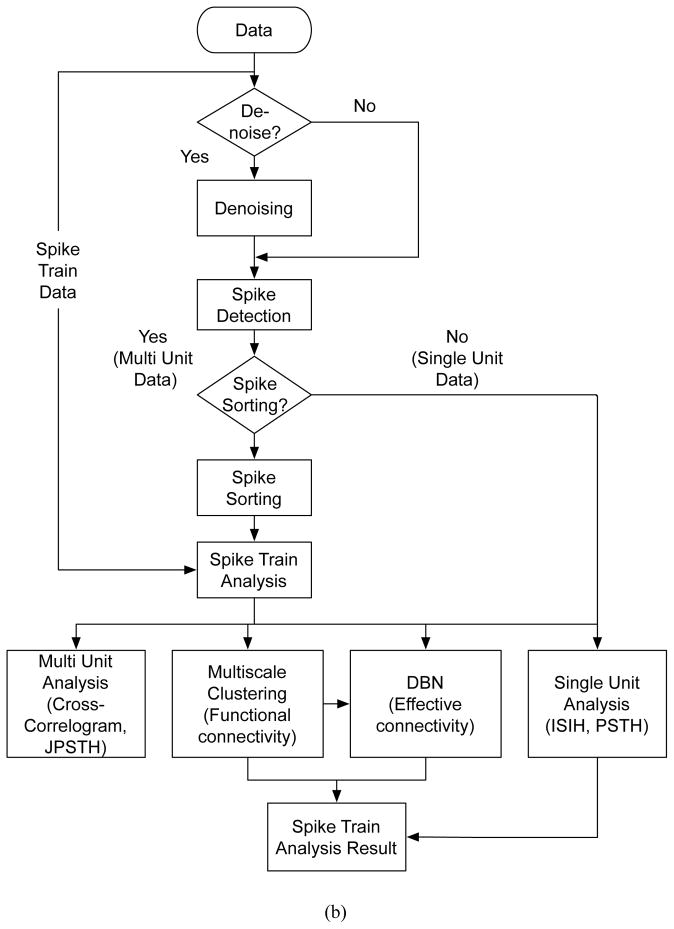
Figure 1. NeuroQuest v1.0 architecture and Flowchart.
(a) Architechture: A total of 6 processing modules (colored blocks) provided in the software are classified into two groups: Processing group and Analysis group. Individual modules are connected through the main GUI which has an access to the input and output data. Spike sorting modules require the raw or preprocessed extracellular recordings, while spike analysis tools handle single or multiple spike trains. Once the input data is loaded, the corresponding group of modules becomes available in the main menu. Each module contains sub-modules that assist to yield more accurate analysis results. (b) Flowchart of NeuroQuest: After the extracellular recording data is loaded, spike sorting tools are activated for further processing. The first stage is to denoise the data to enhance the neural yield. After denoising, spikes are detected and subsequently sent to the spike sorting algorithm to obtain the spike trains. These are further analyzed using the primary spike train analysis tools such as Interspike Interval Histogram (ISIH), Peristimulus Time Histogram (PSTH), Joint Peristimulus Time Histogram (JPSTH), Cross-Correlogram (CC)(Oweiss and Anderson, 2002b; Oweiss, 2010), and the ensemble analysis tools such as functional and effective connectivity estimation.


