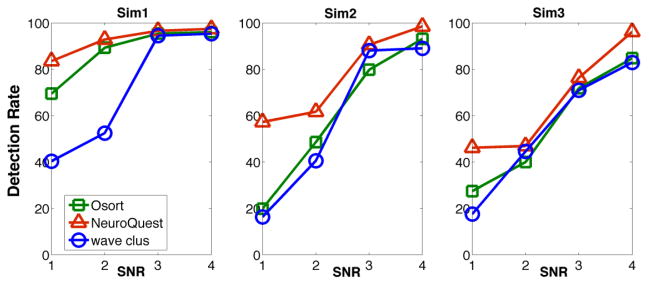
Figure 6. Comparison of spike detection performance in NeuroQuest, wave_clus, and OSort.
Sim1 dataset contains three neurons with different noise levels (1, 2, 3, and 4) that is an average SNR of 1.2, 2.2, 3.4, and 6.7 dB, respectively. Sim2 dataset contains three neurons with an average SNR of 1.3, 1.7, 2.6 and 5.2 dB, respectively. Sim3 dataset contains five neurons, some of which have very similar waveforms, with an average SNR of 1.2, 1.6, 2.3, and 4.7 dB, respectively.

