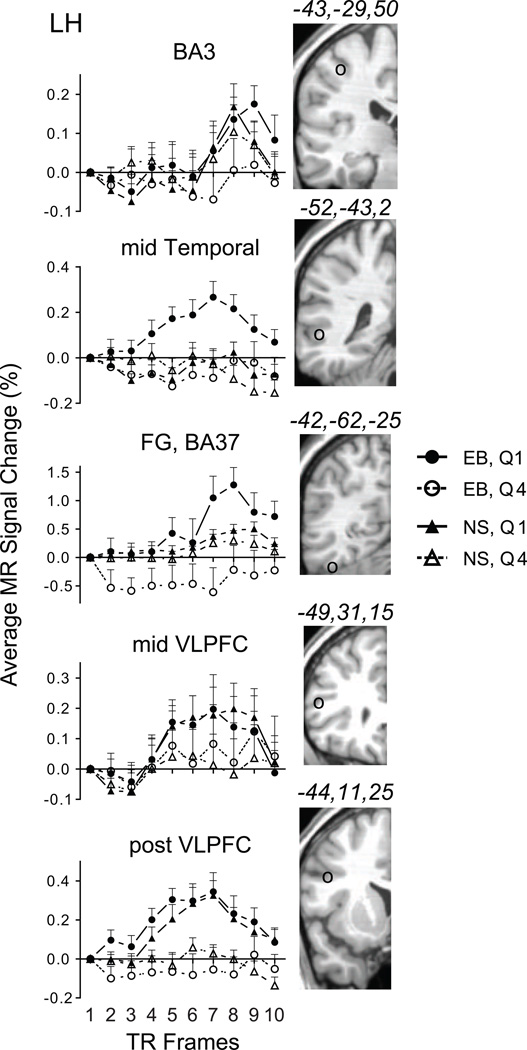
Figure 3.
BOLD response time course plots in early blind and sighted for selected ROI in parietal, temporal, and prefrontal cortex. Brain slices to the right of each plot show the ROI location marked by a circle (○) and corresponding atlas coordinates. Each time point shows the group average and SEM for quartiles 1 and 4 (separately for 11 early blind and 11 sighted participants). See also Table 1. Abb: Brodmann area 3 of primary somatosensory area, BA3; middle temporal cortex, mid Temporal; fusiform gyrus, Brodmann area 37, FG, BA37; middle ventrolateral prefrontal cortex, mid VLPFC; posterior ventrolateral prefrontal cortex, post VLPFC; early blind, EB; sighted, NS; Quartile 1, Q1; Quartile 4, Q4; left hemisphere, LH.

