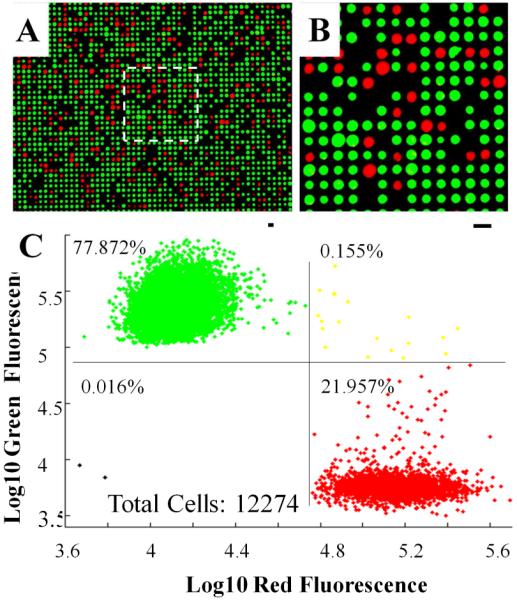
Fig. 3.

Two-color, single-cell analysis. (A) Fluorescence image (10×) of a mixture of Ba/F3 cells on the array stained with CellTracker Green or CellTracker Red. (B) 20× magnification of the region of the array indicated by the white dotted square, scale bar = 20 μm. (C) Dot plot of the fluorescence intensity of 12,274 cells.
