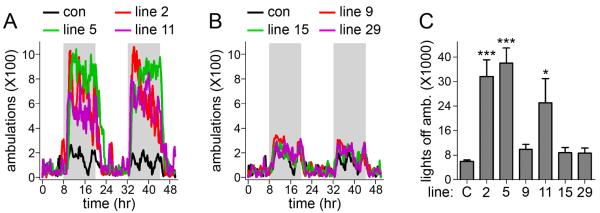
Figure 1.
Home cage locomotor activity in six lines of α6 L9′S mice. A, B. Six α6 L9′S transgenic lines were tested for home-cage locomotor activity over 48 h. Average 48 h activity traces for groups of mice from each line are plotted compared to traces from control, non-transgenic mice. Shaded background indicates lights off and white background indicates lights on. Results fell into two categories and were plotted on separate graphs for clarity: locomotor activity elevated compared to control (A), and locomotor activity comparable to control (B). C. Plots of total ambulations during lights off for control and six α6 L9′S lines. Total ambulations during both lights-off periods during the 48 h experiment were averaged for each individual, and the average for each line is plotted. The number of mice for home-cage hyperactivity was as follows: control, n = 14; line 2, n = 24; line 5, n = 24; line 9, n = 8; line 11, n = 9; line 15, n = 7; line 29, n = 7. Data are mean ± SEM of untransformed data whereas p values are reported for Dunnett’s tests on square-root transformed data. * p < 0.05, *** p < 0.001

