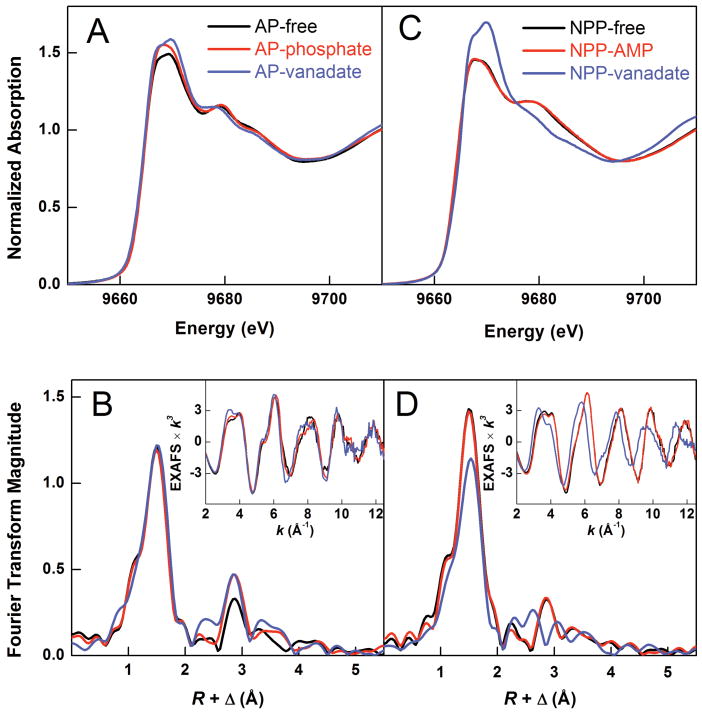
Figure 3.
Zn K-edge XAS data for AP (left) and NPP (right) protein samples: free proteins (black), phosphoryl-group bound (red), vanadate-bound (blue). (a,c) Normalized Zn K-edge spectra; (b,d) Fourier transforms (nonphase shift-corrected) and the EXAFS data (inset). The plotted Fourier transforms were not corrected for the phase shift, i.e., the Fourier transform peaks corresponding to the Zn-ligand distance of R are shifted to lower distances by Δ = 0.4-0.5 Å.

