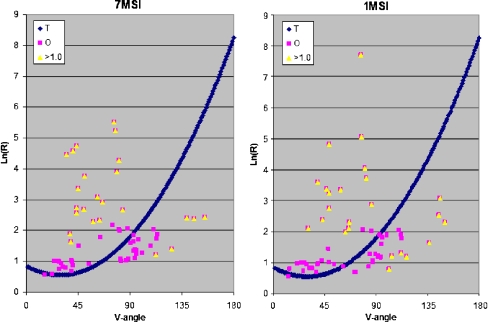
Fig. 2.
The ES model applicability to 7MSI and 1MSI – proteins of lower and higher (respectively) discordance with the assumed model although both of them are treated as representing the structure not accordant with the ES model (Daverage above 1.). The dark blue symbols – theoretical dependence between V-angle and Ln(R), pink squares – observed parameters and yellow triangles – the residues of the higher than 1.0 unit difference between expected and observed values of ln(R) for particular V-angle

