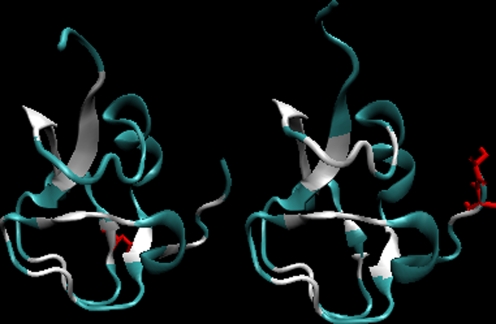
Fig. 3.
The 3-D presentation of the 7MSI (left) and 1MSI (right) proteins differing their lower and higher (respectively) accordance with the LS model. The fragments marked in white – residues of difference higher than 1.0 unit shown in Fig. 1 as yellow triangles. The residues shown in red – mutations versus the wild type

