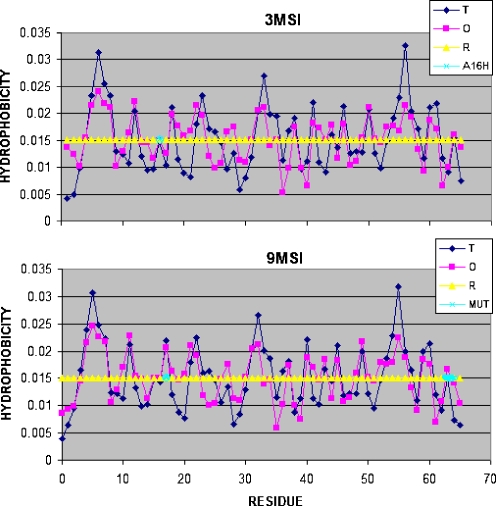
Fig. 4.
The hydrophobic density profile for 3MSI and 9MSI showing the idealized and observed distributions. The proteins were selected to show the lowest and the highest respectively accordance between the idealized (T) and observed (O) hydrophobicity distribution. The yellow line shows the random distribution (R). The residues mutated versus the wild type are shown by cyan circles

