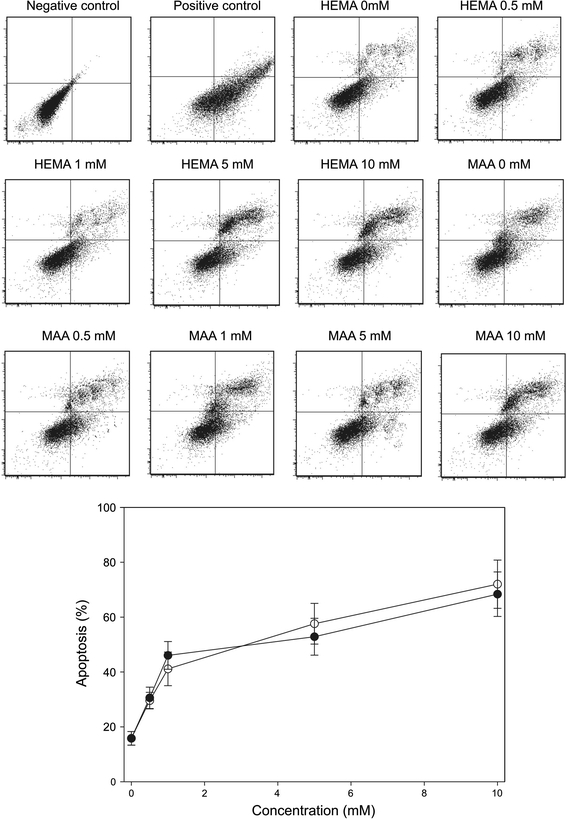
Fig. 9.

Apoptosis of human gingival fibroblasts exposed to 2-hydroxyethyl methacrylate (HEMA) or methacrylic acid (MAA). Apoptosis was assessed by flow cytometry with Annexin V-FITC/propidium iodine (PI). Displayed is the mean of three experiments of 5 × 10⁴ measurements each, error bars denote standard error. The contour diagrams above the plot show one representative experiment out of three for each HEMA and MAA concentration. The lower left quadrant of each diagram shows the viable cells, which exclude PI and are negative for Annexin V-FITC binding. The upper right quadrants contain the non-viable, necrotic cells, positive for Annexin V-FITC binding and for PI uptake. The lower right quadrants represent the apoptotic cells, Annexin V-FITC positive and PI negative, demonstrating cytoplasmic membrane integrity. The apoptosis was expressed as a ratio of the number of early and late apoptotic cells to the number of cells with no measurable apoptosis. P < 0.001 for all HEMA and MAA concentrations as compared with unexposed control
