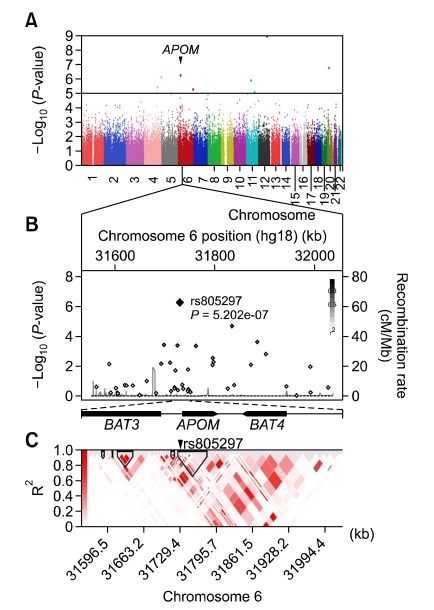
Figure 1.
GWAS results and plots in the region around APOM. (A) Manhattan plot displaying the -log10 (P-value) of SNPs in the GWAS for 100 Korean RA cases and 600 controls. APOM region is marked. (B) The -log10 (P-value) of SNPs around APOM region. SNPs are represented with diamond dots and the most strongly associated SNP (rs805297) was marked with the largest diamond. The strength of LD relationship (r2) between rs805297 and other SNPs is presented with red color intensities based on the JPT + CHB Hapmap data. The background recombination rate curve is drawn with the JPT + CHB Hapmap data (light blue curve). The location and orientation of APOM and neighboring genes are illustrated under the -log10 plot. (C) LD map of the APOM region. The r2 based LD map is drawn with the genotype data of the RA cases and controls using Golden helix SVS software version 7.3.0.

