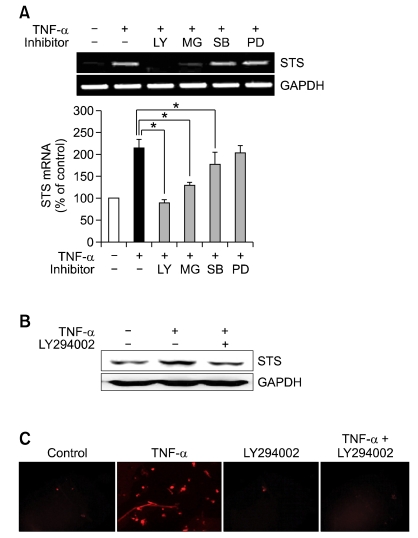
Figure 2.
Effects of specific inhibitors on TNF-α induced STS mRNA expression in PC-3 cells. (A) Cells were pretreated with 20 µM LY294002 (LY), 1 µM MG132 (MG), 1 µM SB203580 (SB), or 2 µM PD168393 (PD) for 30 min before incubation with 40 ng/ml of TNF-α for 18 h. Total RNA was isolated and expression of STS mRNA was assessed using RT-PCR. Expression of GAPDH mRNA was determined as RNA control. The intensities of the PCR products were quantified using a densitometer. The bar graph was obtained by calculating the percentages of the intensity of each PCR products of STS gene relative to GAPDH controls, defined as 100%. The experiments were carried out in triplicates. *P < 0.05 compared with the TNF-α only-treated cells. (B) Cells were pretreated with 20 µM LY294002 for 30 min and then incubated with 40 ng/ml of TNF-α for 18 h. Total cellular lysates were prepared and STS protein expression was determined by Western blot analysis. GAPDH was used as a loading control. (C) Cells were preincubated with 20 µM LY294002 for 30 min before incubation with TNF-α (40 ng/ml) for 18 h. Cells were fixed and incubated with STS antibody. Cells were then stained with Alexa Fluor 594-labeled secondary antibody and fluorescence was determined by fluorescence microscopy.

