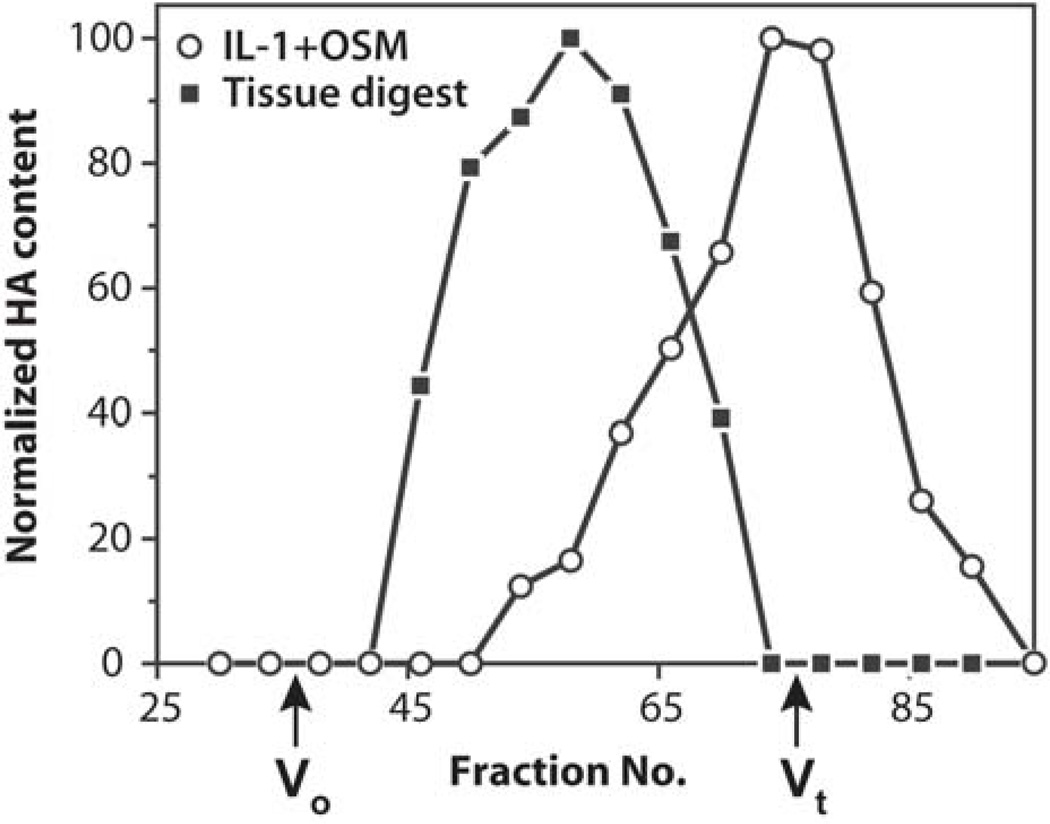
Fig. 7. Analysis of HA size.
Samples of proteinase K cartilage digest (solid squares) and culture media from IL-1β+OSM-treated cartilage (open circles) were analyzed by gel filtration on a Sephacryl S-1000 column. HA content in collected fractions was measured and the highest value for each analysis was set as 100 %. The void volume (Vo) and total volume (Vt) of the column are indicated.

