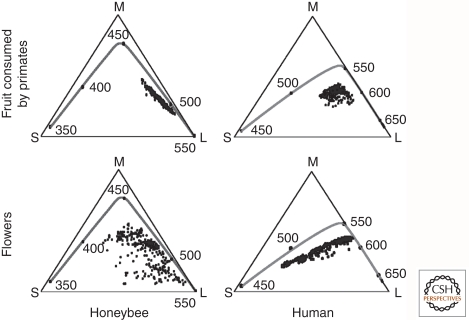
Figure 5.
Chromaticity diagrams for humans and honeybees. The triangles represent a plane within a 3D receptor space, with each vertex corresponding to the point at which the plane intersects an axis representing the degree of excitation of one receptor type. (S) Short-wavelength receptor axis; (M) medium-wavelength receptor axis; (L) long-wavelength receptor axis. The small black circles within the triangles represent the chromaticities of a set of fruits that are consumed by primates (upper panels) or a set of flower petals (lower panels). The line within each chromaticity diagrams represents the locus of spectrally pure lights, with black circles and the adjacent numbers marking steps of 50 nm. (Adapted from Osorio and Vorobyev 2008; reprinted, with permission, from Elsevier © 2008.)

