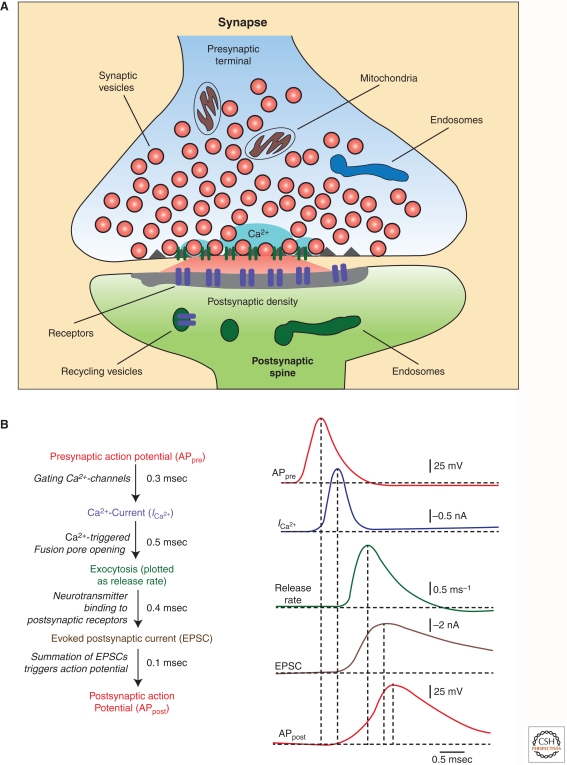
Figure 1.
Principle and time course of Ca2+-triggered synaptic transmission. (A) Schematic diagram of a synapse illustrating the localized influx of Ca2+ at the active zone (red = secreted neurotransmitters). (B) Schematic illustration of the sequence and time course of synaptic transmission as measured by simultaneous pre- and postsynaptic patch-clamp recordings at the calyx of Held synapse. Note that Ca2+ currents and EPSC are shown inverted. (Images are modified from Südhof 2004 and Meinrenken et al. 2003.)

