Fig. 1.
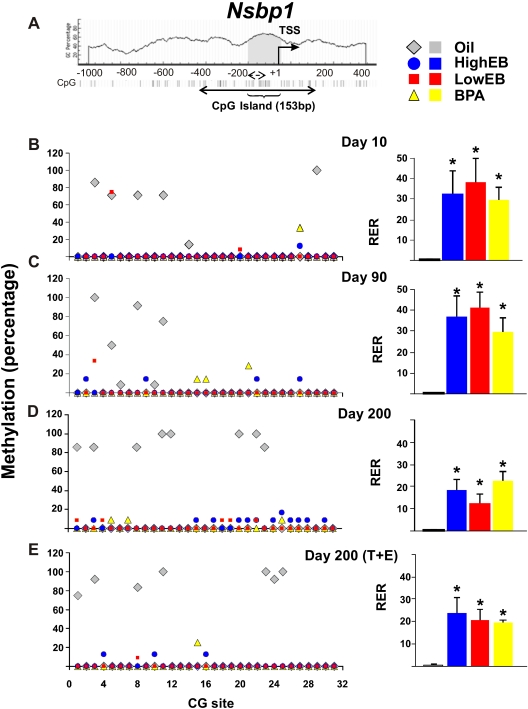
Schematic diagram of CpG dinucleotides content (%) in the 5′ flanking region of the Nsbp1 gene. A, A CGI of 153 bp (gray) was identified between −190 to −38 upstream of the transcriptional start site (TSS). The CGI has 12 CG sites. Here, we studied an expanded region encompassing the CGI. It consists of 517 bp containing a total of 31 CG sites (solid double-headed arrow). Individual CG sites are represented as vertical lines. The methylation status of the region was determined by bisulfite genomic sequencing (solid double-headed arrow) and by MSPCR (broken double-headed arrow, see Fig. 3 for results), respectively. B–E, left panel, DNA isolated from the dorsal prostate of animals treated with HEB (blue circles), LEB (red squares), BPA (yellow triangles), or oil (gray diamonds) at postnatal (PN) d 10, 90, 200, or 200 (T+E2) was subjected to bisulfite genomic sequencing analysis. Methylation status of each CG site of the Nsbp1 promoter is indicated as average percentage methylation. B–E, right panel, RNA was isolated from the dorsal prostate of animals treated with HEB (blue bar), LEB (red bar), BPA (yellow bar), or oil (gray bar) at PN d 10, 90, or 200 (±T+E2). Relative levels of Nsbp1 transcript were determined by real-time PCR and normalized to Rpl19 transcript in the same sample. The relative level of Nsbp1 transcript [relative expression ratio (RER)] at PN d 10 in neonatal oil-treated samples was arbitrarily assigned a value of 1.0, and values from all treatment groups at various life stages were normalized to the mean value of this group. Statistical significant differences are indicated (*, P = 0.05).

