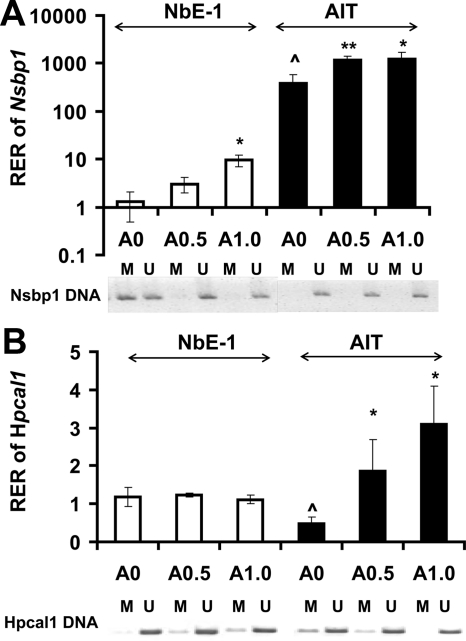
Fig. 3.
Real-time PCR analysis of transcript levels and promoter methylation status of (A) Nsbp1 and (B) Hpcal1 in NbE-1 and AIT cells in response to 5-AZA-dC. Cells were treated with 0.5 or 1.0 μm 5-AZA-dC or with DMSO (0.1%) as the control every 2 d for up to 8 d. Upper panel (A and B), RNA was isolated and reverse transcribed, and levels of Nsbp1 or Hpcal1 transcript were measured by real-time PCR (bar plots). Relative expression ratio (RER) of Nsbp1 or Hpcal1 was calculated by normalizing to Rpl19 transcript levels in the same sample. The RER of gene in DMSO-treated control sample was set as 1.0. Data presented are the means with sd of three independent experiments. *, P < 0.05 or **, P < 0.01 were consider statistically significant (compared with control). ^, Gene expression of NbE-1 and AIT cells differed significantly (P < 0.05). Lower panel (A and B), Methylation status of Nsbp1 or Hpcal1 was analyzed by MSPCR. DNA isolated was modified by sodium bisulfite followed by PCR, with primers specific for methylated DNA (M) or unmethylated DNA (U). Representative results from one of the three independent experiments are shown.

