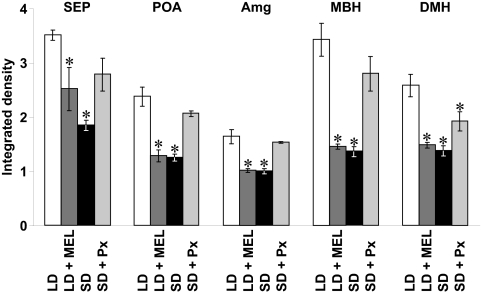
Fig. 6.
Effects of photoperiod, melatonin administration (MEL), and Px on the expression of GnIH-ir fibers. LD, Integrated density of GnIH-ir fibers in hamsters maintained in LD; LD + MEL, integrated density of GnIH-ir fibers in hamsters administered sc with melatonin (50 μg per SILASTIC plate) and maintained in LD for 13 wk; SD, integrated density of GnIH-ir fibers in hamsters kept in SD for 13 wk; SD + Px, integrated density of GnIH-ir fibers in hamsters Px and maintained in SD for 13 wk. The integrated density of GnIH-ir fibers was measured as a grayscale value from 0 (white) to 256 (black) and expressed as the mean density in each brain region, which was obtained by subtracting background gray values. Each column and the vertical line represent the mean ± sem (n = 4 samples; one sample from one animal). *, P < 0.05 vs. LD by one-way ANOVA, followed by Bonferroni's multiple range test.

