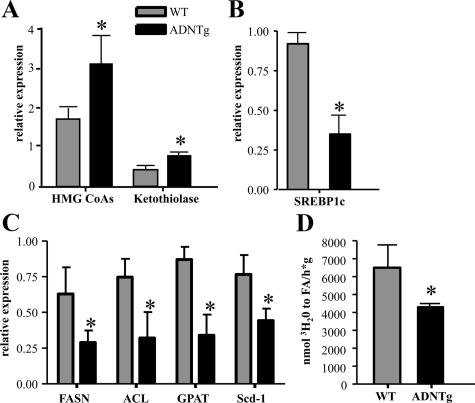
Fig. 3.
Expression of key liver lipid metabolism genes and rates of fatty acid synthesis. Expression of HMG-CoA synthase and ketothiolase (A), SREBP-1c (B), and SREBP-1c responsive genes (C) were measured via RT-PCR in four WT and four ADNTg mice that were 6 h fasted in the light cycle using β-actin as the internal control. The rates of hepatic fatty acid synthesis (D) were determined in the livers of five WT and five ADNTg animals using 3H2O ip injection. Measurements were all made in fed state, 2 h into the dark cycle, in 13-wk-old animals. *, P < 0.05.

