Fig. 1.
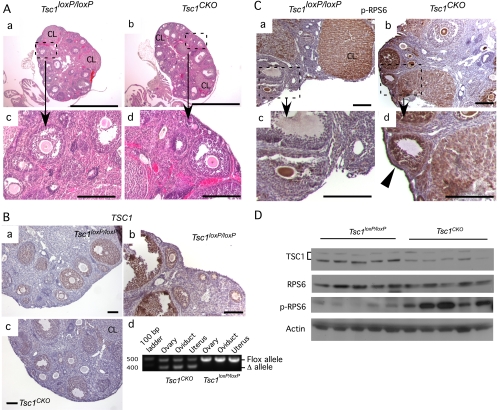
Ovaries from Tsc1CKO mice show induced phosphorylation of RPS6. A, H&E of typical ovarian sections from 8-wk-old control Tsc1loxP/loxP (a and c) and Tsc1CKO mice (b and d) showing the presence of follicles in various stages of development. B, In control ovaries, TSC1 expression by IHC shows strongest expression in developing follicles (a and b); in Tsc1CKO ovaries, TSC1 expression is much lower in developing follicles (c); PCR analysis of genomic DNA from the indicated sources shows the deleted allele is amplified in tissues expressing Amhr2-Cre (d). C, The p-RPS6 levels were high in oocytes and corpus luteum (CL) but low or absent in granulosa cells of developing follicles in Tsc1loxP/loxP ovaries by IHC (a and c); in Tsc1CKO ovaries, p-RPS6 levels were high in granulosa cells of developing follicles of Tsc1CKO ovaries (b and d) and also appeared higher in the surface epithelium (d, arrowhead). Photos are representative of n = 3 for each group. D, Western analysis shows lower levels of Tsc1 and higher levels of p-RPS6 in the mutant ovaries. Each lane corresponds to an ovary from n = 5 control and mutant mice. Semiquantitative analysis shows that TSC1 levels are 3-fold greater in control ovaries (56.3 ± 0.5 vs. 18.3 ± 0.4, P < 0.01) and p-RPS6 levels are 2-fold greater in Tsc1CKO ovaries than in controls (10.8 ± 0.2 vs. 5.6 ± 0.2, P < 0.01). In A and C, boxed areas in a and b are shown at higher magnification in c and d, respectively. CL, Corpus luteum. Bars, 100 μm except for those in A, a and b, which are 1 mm.

