
Figure 2.
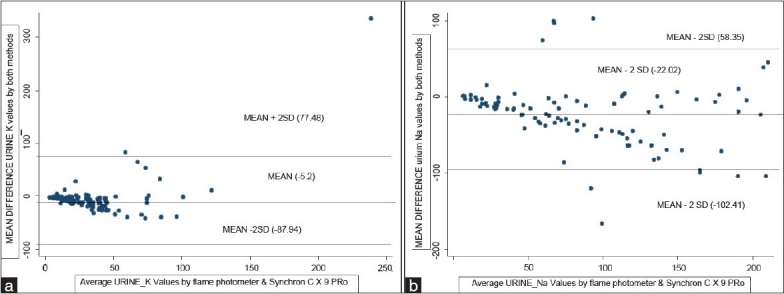
(a) Mean difference urine potassium (K) vs average urine potassium (K) values by Flame Photometer and Synchron Cx9 PRO (Bland and Altman Plot) 95% limits of agreement = mean difference ± 2 SD [77.48, -87.94] (b) Mean difference urine sodium (Na) vs average urine sodium (Na) values by Flame Photometer and Synchron Cx9 PRO (Bland and Altman Plot) 95% limits of agreement = mean difference ± 2 SD [58.35, -102.41]