
Figure 1.
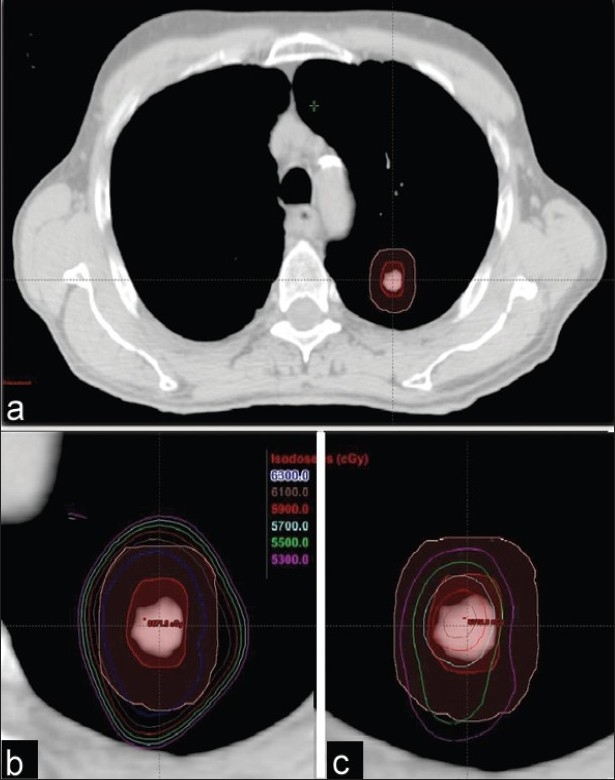
(a) ITV and PTV contours of a typical NSCLC patient planned with SBRT. The six isodoses represent 53-63 Gy with increments of 2 Gy, and both views (b) PBC and (c) AAA (slightly magnified to display better the spread of isolines) are shown at the treatment plan isocenter