
Figure 5.
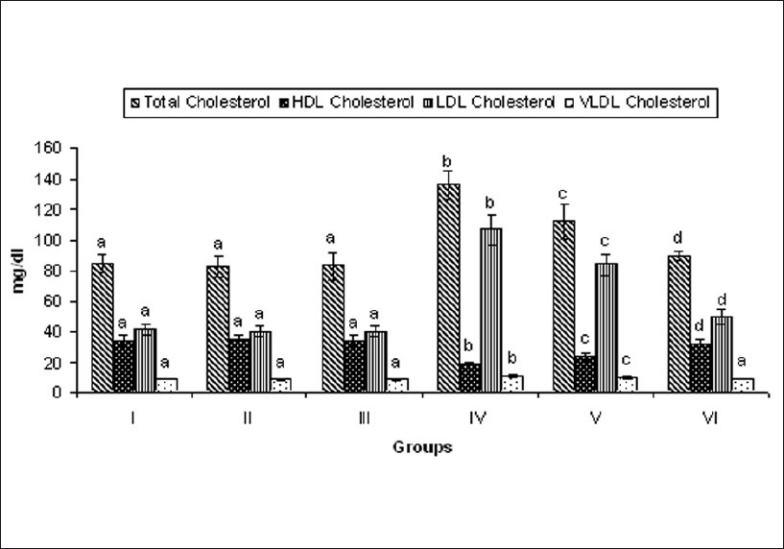
Effect of MELD on levels of lipids and lipoproteins. Values are expressed as mean ± standard deviation from six animals in each group. Significant (P < 0.05) compared to normal
Official websites use .gov
A
.gov website belongs to an official
government organization in the United States.
Secure .gov websites use HTTPS
A lock (
) or https:// means you've safely
connected to the .gov website. Share sensitive
information only on official, secure websites.
Effect of MELD on levels of lipids and lipoproteins. Values are expressed as mean ± standard deviation from six animals in each group. Significant (P < 0.05) compared to normal