
Figure 6.
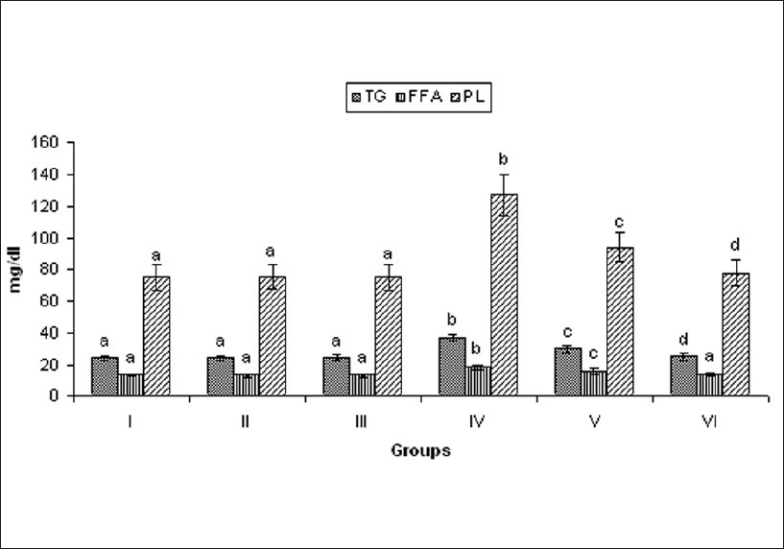
Effect of MELD on levels of TG, FFA, and PL. Values are expressed as mean ± standard deviation from six animals in each group. Significant (P < 0.05) compared to normal
Official websites use .gov
A
.gov website belongs to an official
government organization in the United States.
Secure .gov websites use HTTPS
A lock (
) or https:// means you've safely
connected to the .gov website. Share sensitive
information only on official, secure websites.
Effect of MELD on levels of TG, FFA, and PL. Values are expressed as mean ± standard deviation from six animals in each group. Significant (P < 0.05) compared to normal