
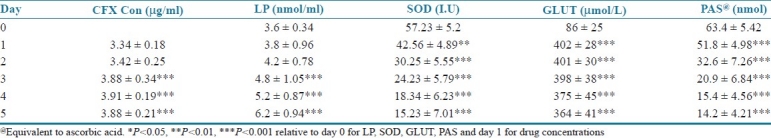
Table 1.
Plasma concentration of CFX, lipid peroxides, SOD, glutathione and PAS on different days. Values represent mean ± SD of 16 patients
Official websites use .gov
A
.gov website belongs to an official
government organization in the United States.
Secure .gov websites use HTTPS
A lock (
) or https:// means you've safely
connected to the .gov website. Share sensitive
information only on official, secure websites.
Plasma concentration of CFX, lipid peroxides, SOD, glutathione and PAS on different days. Values represent mean ± SD of 16 patients