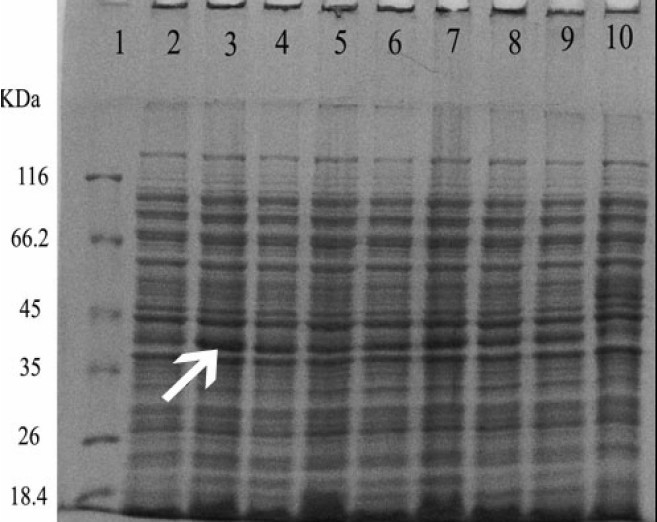
Fig. 2.

Induction of the expression of reteplase by different concentrations of IPTG in E. coli BL21 cells. Proteins in the whole cell lysates were separated using SDS-PAGE. Line:1) protein marker, Lane:2) rpETBL21 induced with 1.5 mM IPTG, Lane:3) rpET-BL21 induced with 1 mM IPTG . Lane:4) rpET-BL21 induced with 0.5 mM IPTG, Lane:5) rpET-BL21 induced with 0.25 mM IPTG, Lane:6) rpET-BL21 induced with 1.5 mM IPTG, Lane:7) rpET-BL21 induced with 1 mM IPTG. Lane:8) rpET-BL21 induced with 0.5 mM IPTG, Lane:9) rpET-BL21 induced with 0.25 mM IPTG (0.25 mM), Lane:10) BL21 induced with 1 mM IPTG .Arrow shows the 39 kDa reteplase band.
