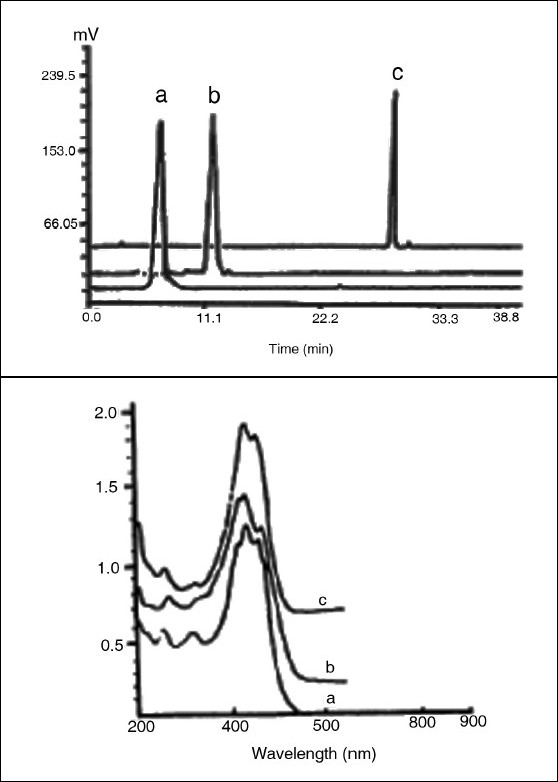
Figure 3.

Chromatogram and UV-visible spectra of the crocins: a = crocin 1; b = crocin 2; c = crocin 3.
Mass spectrometric analysis of the crocins was performed with a MALDI-TDFMS instrument with an α-cyanocinnamic acid as matrix. 1H NMR spectra were recorded at 25°C (crocin 1 in DMSO σ-6, crocin 2 and crocin 3 in CD3OD-CD3COCD3-D2O, 1:1:1) by means of a Varian Inova-400 spectrometer (400 MHz) equipped with a 5-mm1H/13C/19F/31P probe for 1H spectra.[38]
