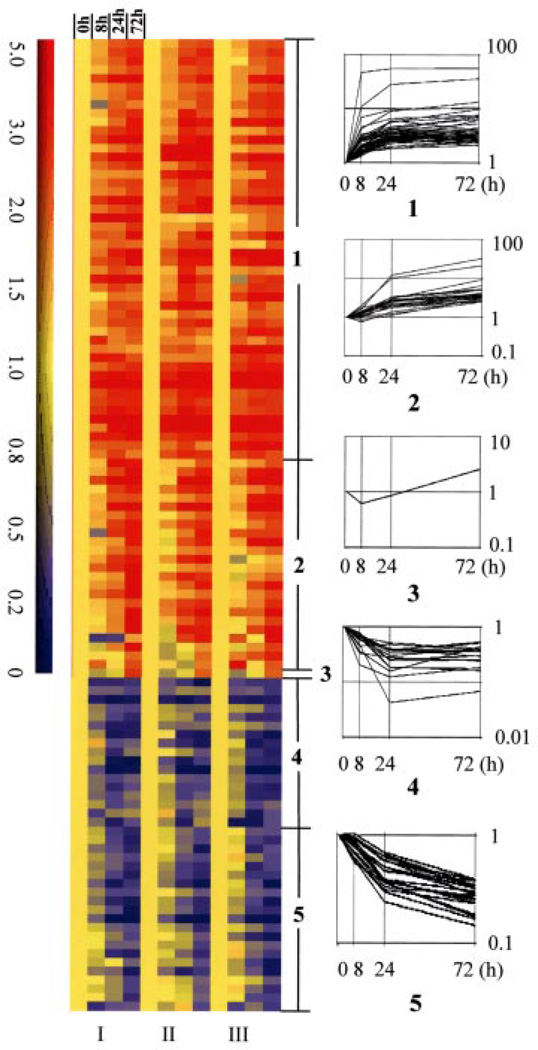
FIGURE 1. Gene expression profiles in OVCAR3 cells after 1,25-(OH)2D3 treatment.
RNA isolated from OVCAR3 cells treated with 1,25-(OH)2D3 for 0, 8, 24, or 72 h was subjected to microarray analyses. Three independent analyses (I–III) were performed in Affymetrix U133A chips. A total of 96 genes with less than 5% false detective rate in SAM analysis (delta = 0.653) and at least 2.5-fold changes were selected for clustering analysis (GeneSpring software, Silicon Genetics). Genes are presented in rows. The time of 1,25-(OH)2D3 treatment and the number of array analyses are indicated above and below the column. Up- and down-regulated genes are shown with a colorimetric scale to indicate the relative expression levels. Numbers 1–5 show five different clusters identified by gene tree clustering.

