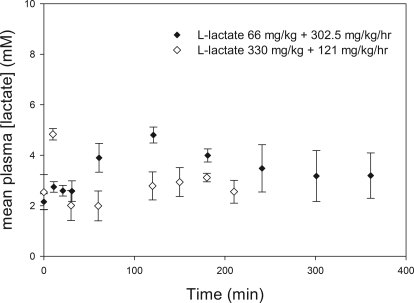
Fig. 3.
Plasma l-lactate concentrations after concomitant l-lactate and GHB administration. l-Lactate was administered 5 min after GHB administration, time 0. Closed symbols represent data from serially sampling for up to 360 min in rats administered intravenous GHB at 1500 mg/kg + l-lactate at 66 mg/kg followed by 302.5 mg/kg per hour (n = 4 total). Open symbols represent data from rats sacrificed at up to 210 min after intravenous administration of 600 mg/kg GHB + 330 mg/kg l-lactate followed by 121 mg/kg per hour (n = 3 at each time point). Data are presented as mean ± S.D.

