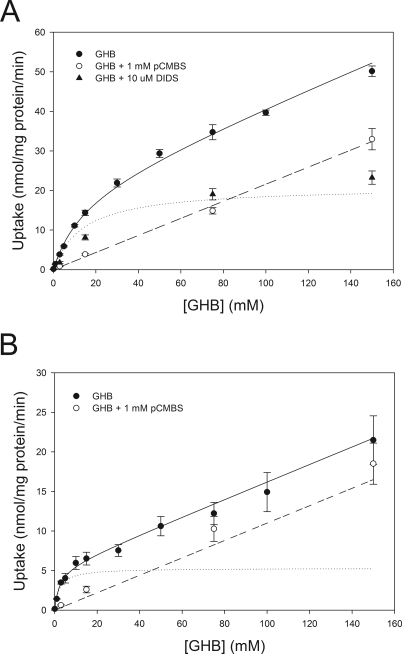
Fig. 4.
Concentration-dependent uptake of GHB in rat RBCs. A, uptake at pH 7.4. B, uptake at pH 6.5. Closed circles, total transport. Open circles, transport in the presence of 1 mM pCMBS. Closed triangles, transport in the presence of 10 μM DIDS. Data are presented as mean ± S.E.M. Total transport and transport in the presence of pCMBS were simultaneously fitted by nonlinear regression represented by the solid (total transport) and dashed (pCMBS) lines, respectively. Dotted line, simulated MCT-mediated transport using fitted Km and Vmax values.

