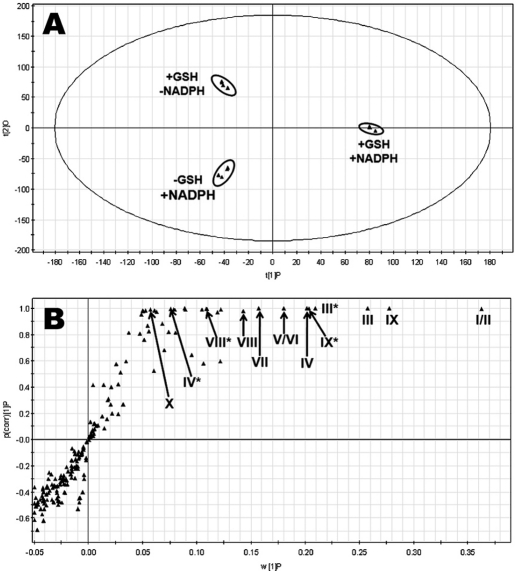
Fig. 1.
Metabolomic analysis of control groups and GSH-trapped group of LPV in the incubations with HLM. The incubation conditions of LPV were detailed in experimental procedures. All samples were analyzed by UPLC-TOFMS. A, separation of each incubation group in OPLS-DA score plot. The t[1]P and t[2]O values represent the score of each sample in principal component 1 and 2, respectively. B, loading S-plot generated by OPLS-DA analysis. The x-axis is a measure of the relative abundance of ions, and the y-axis is a measure of the correlation of each ion to the model. The top ranking ions are labeled. *, in-source fragment.

