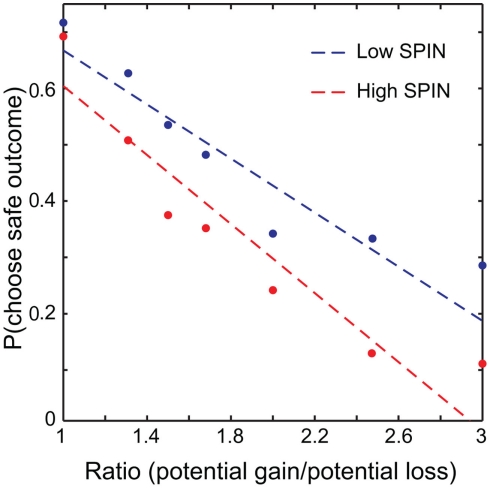
Figure 2.
Probability of choosing the safe option plotted against ratio. A median split was performed, with data from low social phobia (SPIN) individuals plotted in blue and high SPIN in red. Linear fits were determined across all trials with ratio modeled as a continuous variable. For illustration, choices were grouped into seven ratio bins (1, 1.25/1.3333, 1.5, 1.6667/1.75, 2, 2.3333/2.5, 3) and plotted against mean probability of choosing the safe option for high and low SPIN participants.

