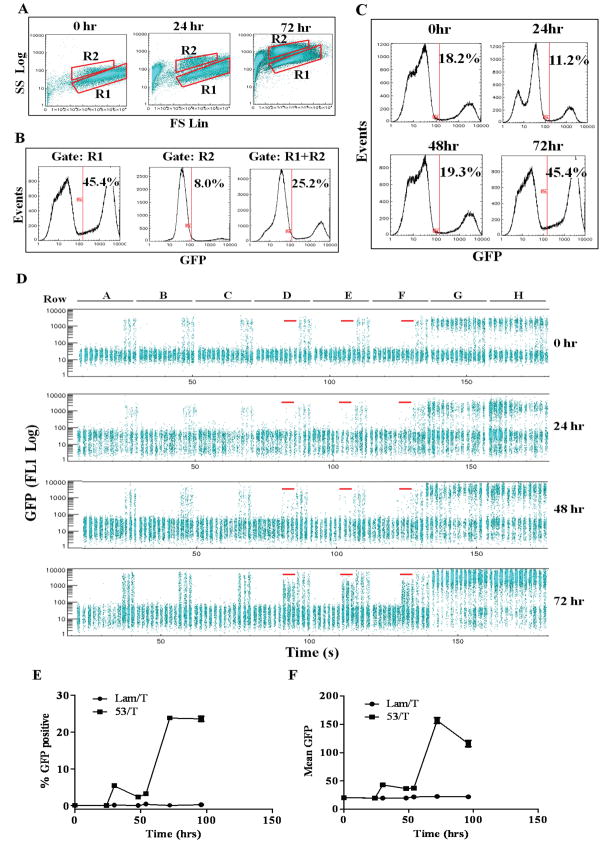
Fig. 4.
Evaluation of the flow cytometry based array approach by analysis of the GFP signal at different time points post-mating. The bait plate and the prey plate were grown over night and mated with each other in YPD media. Positive PPIs were selected in SD-T-L-H media and cells were sampled at 0, 24, 30, 48, 54, 72 and 96 hrs post-mating to measure the GFP signal by HyperCyt/CyAn flow cytometer. (A) FSC/SSC dot plot analysis of two populations of cells in regions R1 and R2 from the whole 96-well plate at 0, 24 and 72 hrs post mating. (B) Histogram analysis of GFP signals of the cells in regions R1, R2 and R1 plus R2 from the whole 96-well plate at 72 hrs post-mating. The percentage of GFP positive cells in each region is shown. (C) Histogram analysis of the GFP signal of the cells in the region R1 at 0, 24, 48, 72 hrs post mating. The percentage of GFP positive cells on the whole plate at each time point is shown. (D) The GFP signal of the cells in each well at 0, 24, 48, 72 hrs post mating are shown in alignment. The 9 wells containing the P53/T mating pairs at each time point are highlighted by red line. (E) The mean value of the percentage of GFP positive cells (mean± SD) in all 9 wells containing the P53/T or Lam/T mating pairs are shown as a function of time. (F) The mean value of the GFP fluorescence of the cells (mean± SD) in all 9 wells containing the P53/T or Lam/T mating pairs are shown as a function of time.

