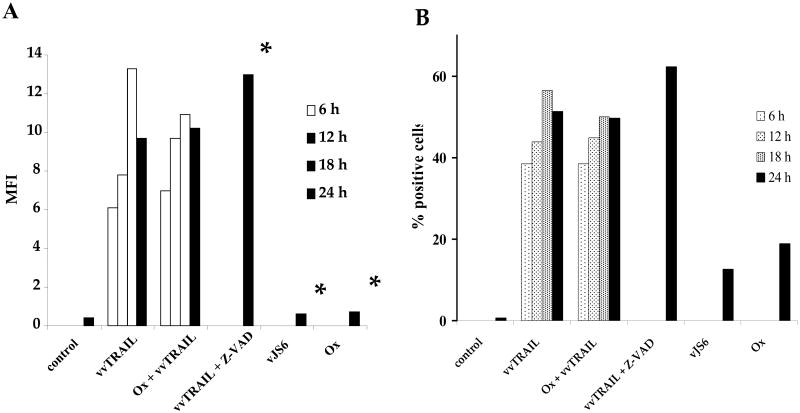
Figure 2. Expression of TRAIL in vvTRAIL-infected cancer cells.
TRAIL expression in DLD1 cancer cells was evaluated by antibody labeling followed by flow cytometry. Designated cells were treated with vvTRAIL or vJS6 at an MOI of 0.25. Ox concentration was 1.0 μg/ml. The concentration of the pan-caspase inhibitor ZVAD was 20 μM. Cells were harvested for flow cytometry at the indicated time points and labeled with a phycoerythrin-conjugated antibody specific for TRAIL. Results are expressed in terms of MFI (A) or % TRAIL-positive cells (B). *Cells treated with vvTRAIL + Z-VAD, vJS6 or Ox alone were analyzed only at the 24 h time point.

