
Figure 4. Apoptosis/necrosis in the colorectal cancer cells treated with the single agents or combinations.
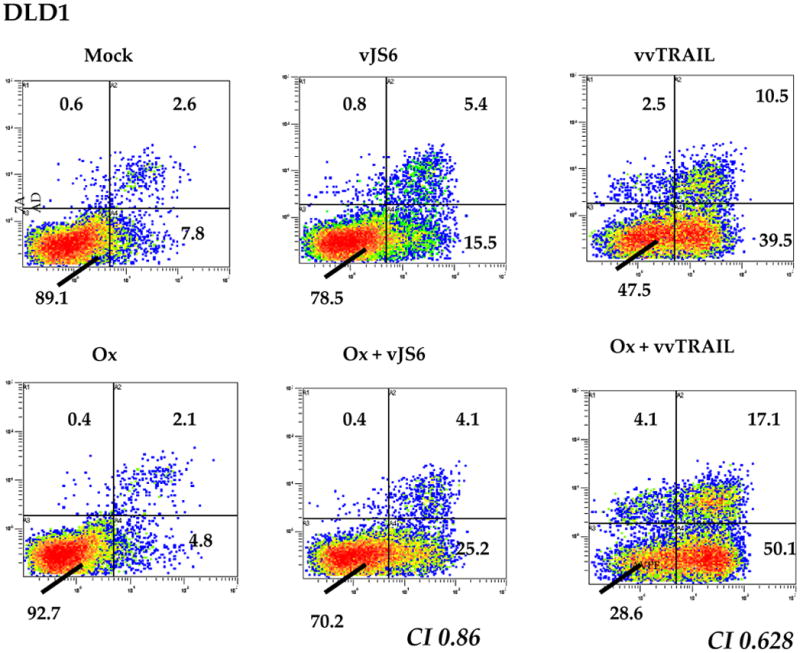
Ox [0.5 μg/ml] and virus [MOI = 0.25] were used for DLD1 cells. Ox [0.5 μg/ml] and virus (MOI = 0.1) were used for HCT116 cells. For MC38 cells, Ox [1.0 μg/ml] and virus (MOI = 0.1) were used. Shown are data from DLD1 cancer cells. Data for HCT116 and MC38 cells are presented as supplemental Figure 1. Apoptosis/necrosis was evaluated using Annexin V-PE and 7AAD. X-axis: Annexin V-staining; Y-axis: 7AAD staining. Representative data of 3 independent experiments are shown.