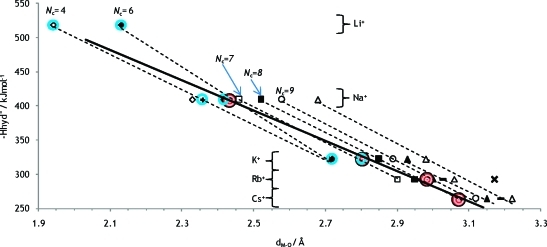
Figure 13.
Heats of hydration as a function of the inverse metal oxygen distance. Dashed trendlines are shown for the occurring hydration numbers 4, 6, 7, 8, 9, 10, and 12. Experimental values from this and a previous61 work are shown in red-white circles, and a possible linear relationship is shown with a solid line. Other values are based on crystal structures whereof values within blue circles are from the radii proposed in Table 1 and all other values are from Shannon radii of different coordination numbers, ref (37).

