
Figure 9.
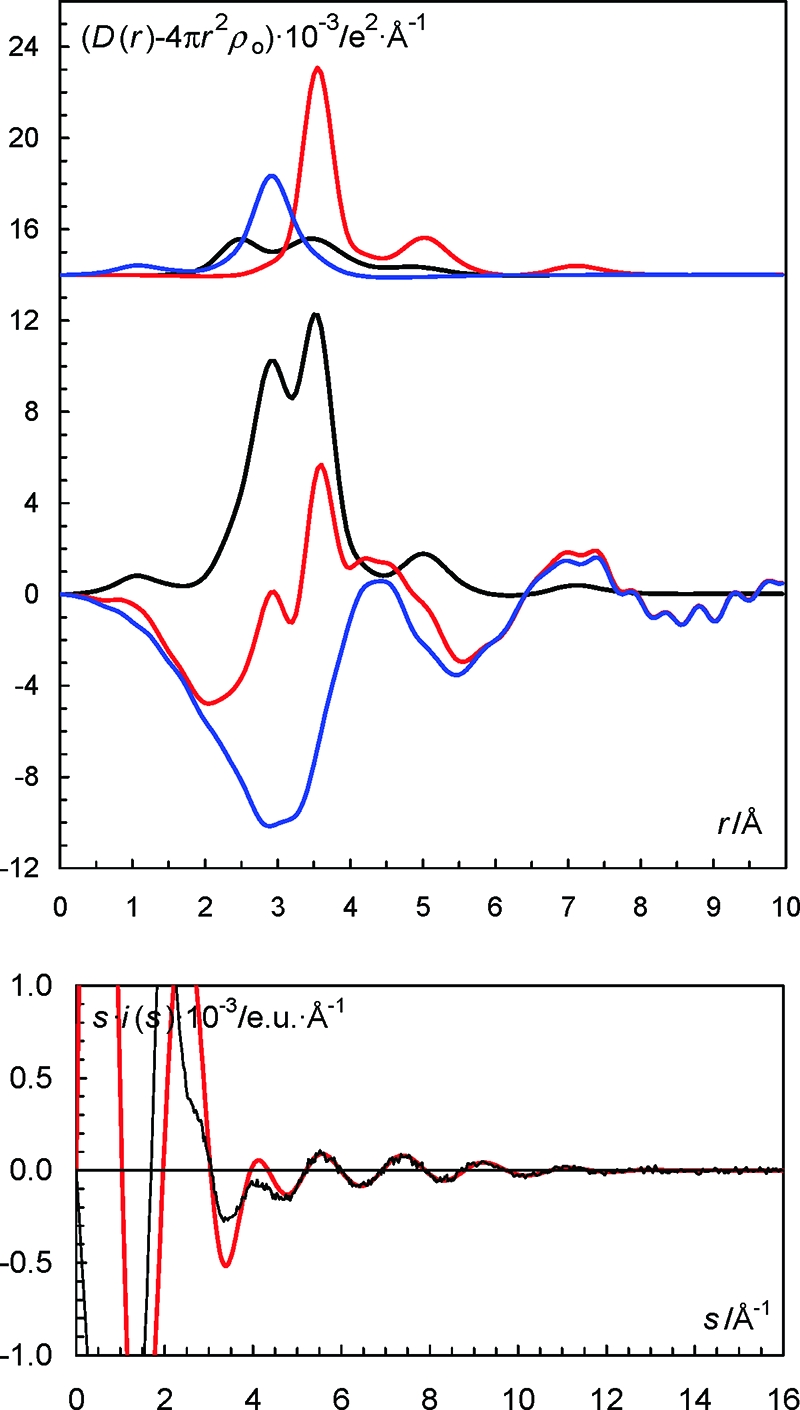
(Top) LAXS radial distribution curves for a 2.007 mol·dm–3 aqueous solution of sodium iodide. Upper part: Separate model contributions (offset: 14) of the hydrated sodium ion (black line), the hydrated iodide ion (red line) and the aqueous bulk (blue line). (Middle) Experimental RDF: D(r) – 4πr2ρo (red line), sum of model contributions (black line) and the difference between experimental and calculated functions (blue line). (Bottom) Reduced LAXS intensity functions s·i(s) (solid line); model s·icalc(s) (dashed line).